
You’ve worked hard to create a great website. So you want people to spend time interacting with it, getting to know your brand, and (hopefully) deciding to become a customer. Another reason you want site visitors to spend time on your website is because this signals to search engines that your content is worth delivering to searchers.
To make sure you’re satisfying site visitors and search engines, you need to pay attention to the average time on page metric.
Average time on page is exactly what it sounds like: it’s the average amount of time visitors spend on a webpage.
But how exactly is it measured? What is a good average time on page? And how do you find out a webpage’s average time on page? Read on to learn the answers to these important questions.
Why Is Average Time on Page an Important Metric to Track?
How website visitors interact with your site matters. Content Square data shows that websites with higher activity (that is, more visitor interaction) have 19% higher conversion rates and 20% lower bounce rates than sites with lower activity.
The more time people spend on your webpages, the more time you have to get them into your sales funnel — which is the goal of most business websites. If site visitors are quickly clicking away from your pages, you’re losing the chance to build a relationship with them or turn them into customers.
When visitors don't spend much time on a page, that's an indicator that they don’t find it helpful or useful. But the problem is not only that you’re losing potential customers when these people click away quickly — because a low average time on page can also be a red flag to Google and other search engines.
Consequently, low average time on page can theoretically lead to low search engine rankings. Google has admitted to using interaction data and engagement metrics to measure a document’s quality.
Ultimately, there are a host of reasons that you don't want site visitors to click away quickly, so paying attention to average time on page — and working to improve this page metric — is a worthwhile goal.
What Is a Good Average Time on Page?
Inspiring people to stay on your page for longer may be more difficult than ever.
That's because data shows that the average session duration is shrinking across all devices and all industries. Session duration is the total time visitors spend on a site.
In 2022, desktop session durations dropped 5.4% while mobile sessions dropped 8.9%. Overall, this means there was a 7.5% reduction in session durations, so visitor attention is clearly becoming more limited.
Shorter sessions could be explained by many factors, from the rise in mobile browsing as an alternative to desktop browsing to the simple fact there's just so much content now to consume.
Still, since consumers are on the whole spending less time consuming content on each individual website, it's helpful to measure your average time on page against what others in your industry are experiencing, to see whether your pages do better or worse than those of your peers in terms of capturing attention.
After all, people visit sites for different reasons, and it makes sense to spend more time on certain kinds of pages — such as blog posts — than on others, such as individual product pages or landing pages with limited text but lots of links.
Average time on page varies not only by page type but also by industry. Content Square found that:
- B2B sites had an average time on page of 1.37 minutes, which is the highest average of any industry. This beat every other industry by at least 20 seconds
- Grocery and energy sites had the lowest average time per page, with an average of 44 seconds.
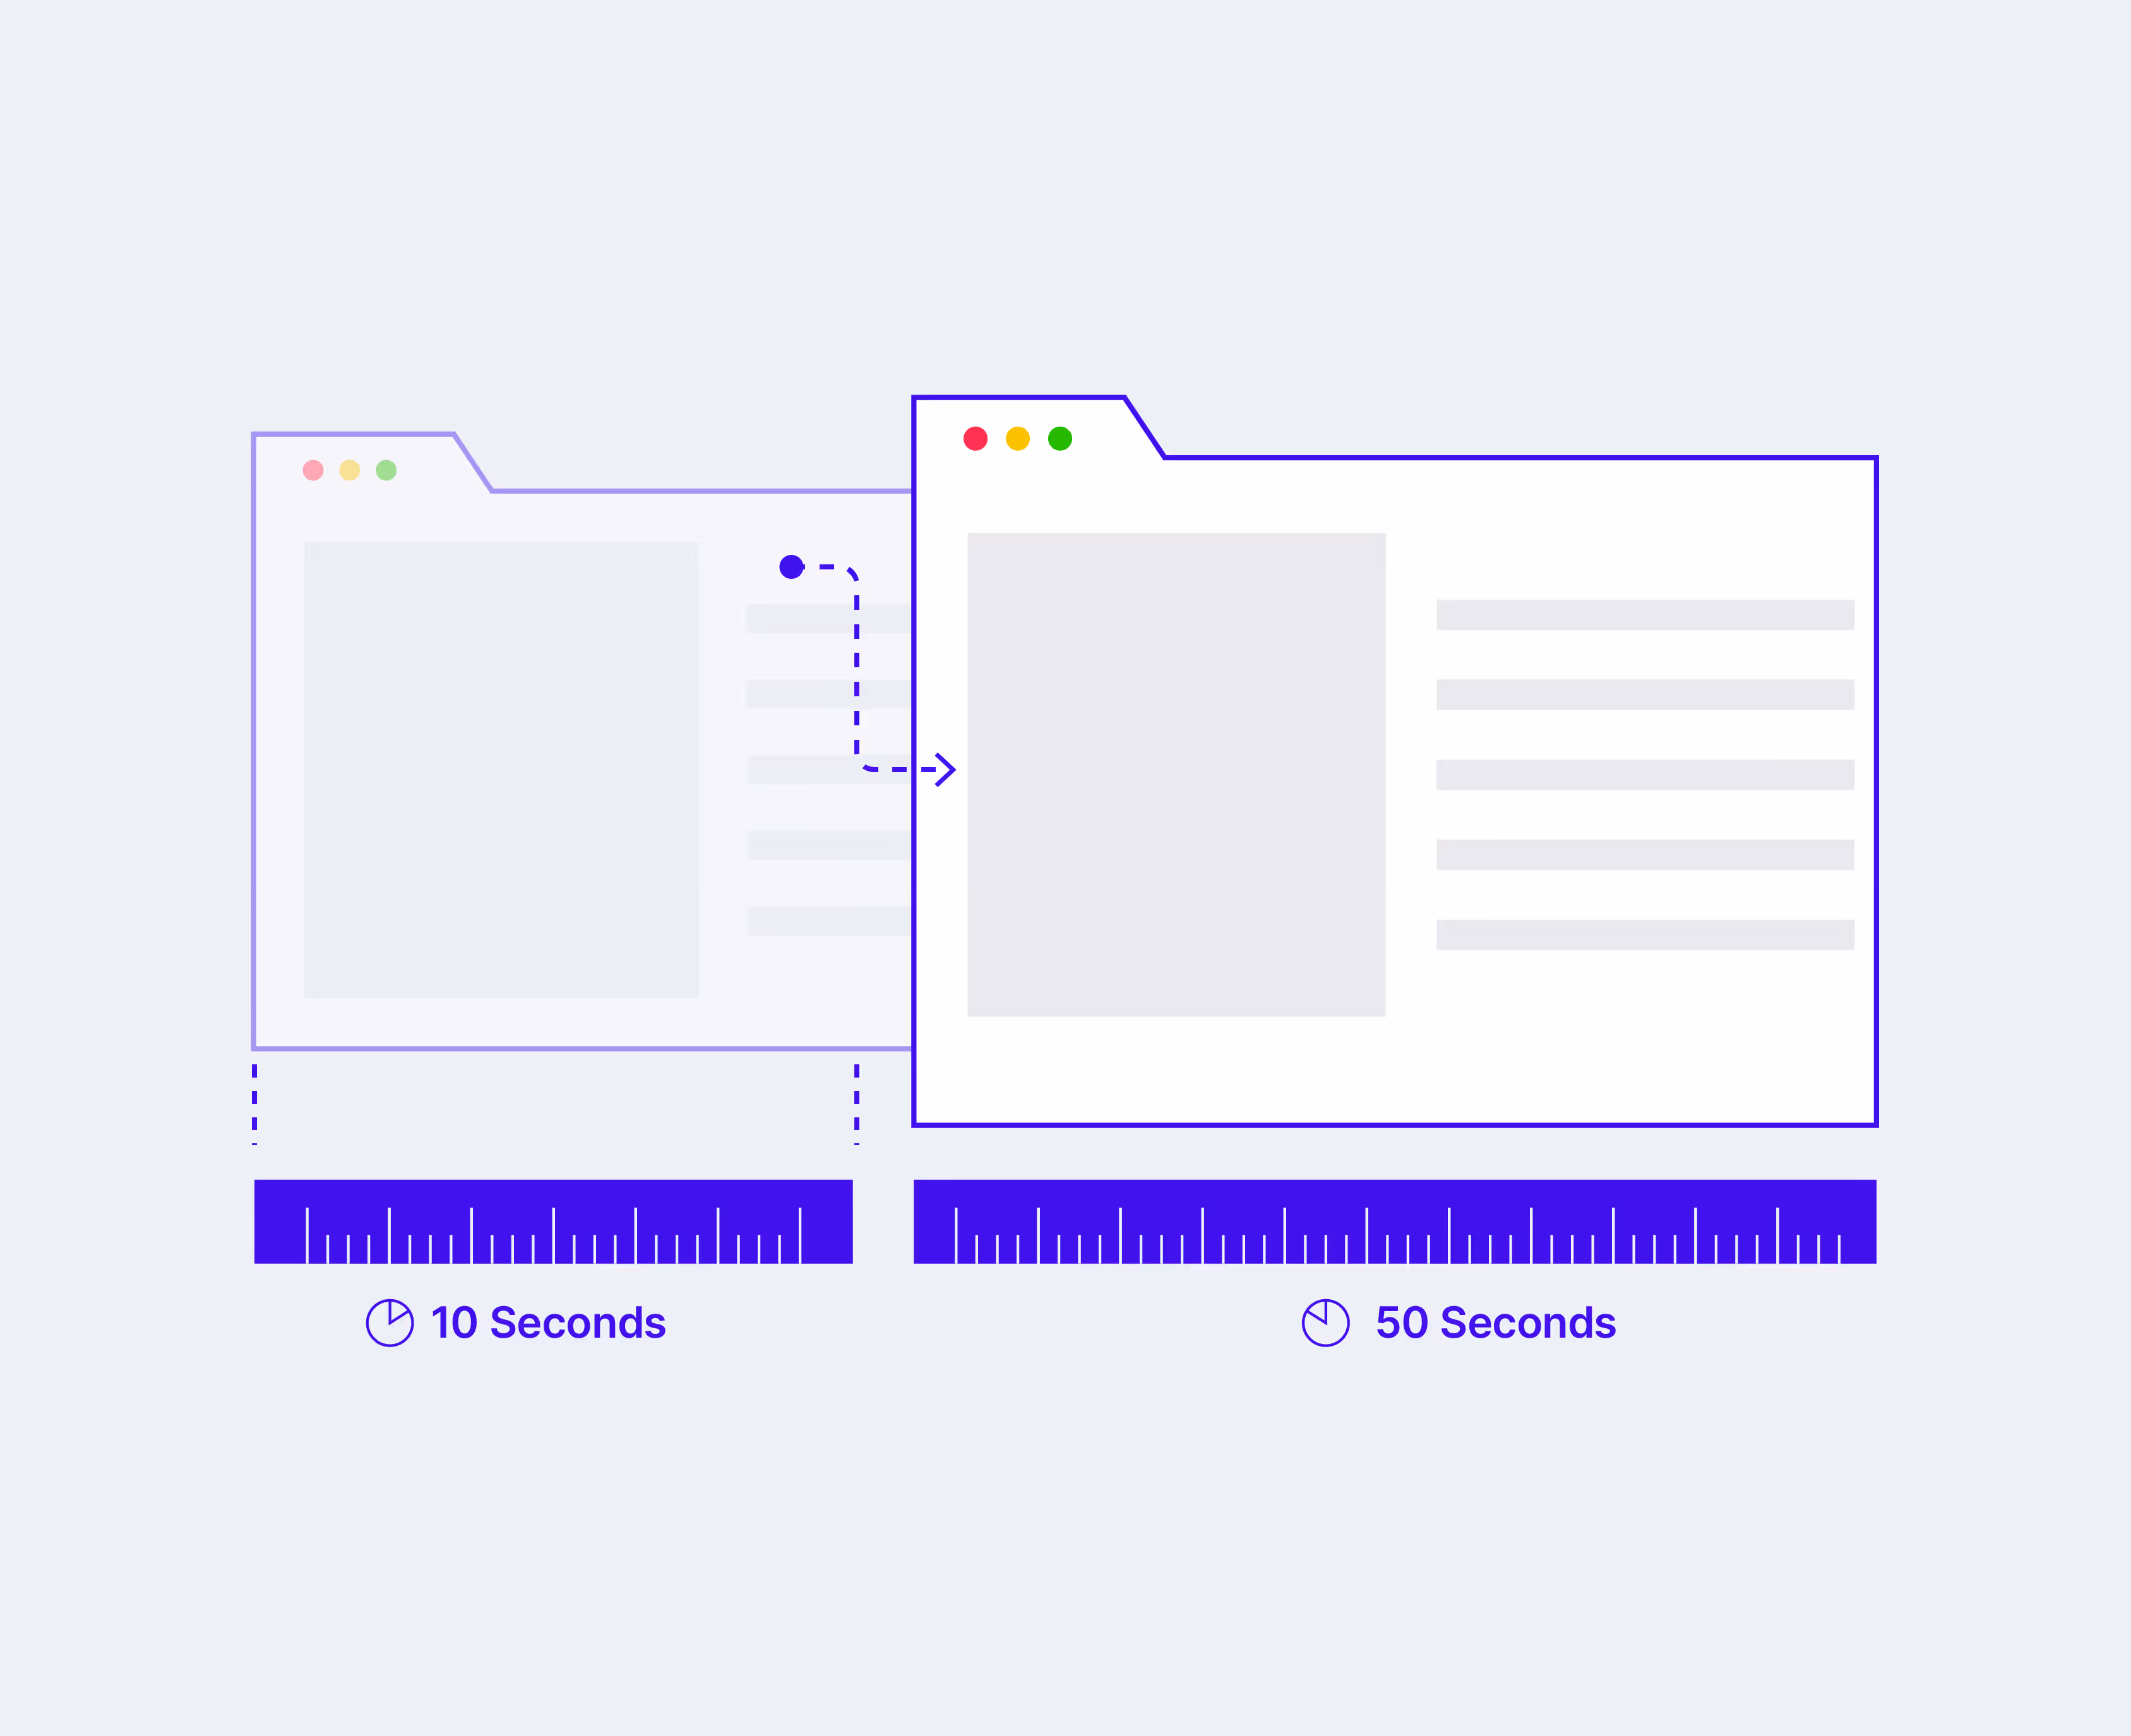
On the other hand, a good overall average time per page was 52 seconds.
However, if visitors stay on some of your pages for a shorter time, that's not necessarily a problem. Many factors, including the goal of the page and visitors’ search intent, should be taken into account when determining whether the average time on each page is good or needs improvement.
How to Improve Average Time on Page
If you want people to spend more time on your pages, you need to provide them with an incentive to stay. This means making sure that your content is both helpful and visually appealing. Here are a few ways you can do that.
Use Engaging Hooks and Leads to Entice Visitors to Keep Reading
You have one chance to make a first impression: Yyur introduction. A reader who looks at the intro to your content should see immediately:
- How you can solve their problem.
- Why your information is useful and informative.
Try to engage the reader from the start so they want to see what else you have to say. Some techniques I use to do that include:
- Considering search intent and answering the reader's questions immediately.
- Including an interesting stat or expert opinion to develop trust and establish authority.
- Explaining what the reader will see if they stay on the page and keep reading.
Integrate Helpful Videos and Graphics
No one likes to look at a big block of text, so don't just leave visitors looking at a sea of words. Instead, break up your written content with videos and graphics.
Graphics can present information in more visually compelling ways that inspire people to take a closer look. Videos can do a lot to improve your average time on page if people take the time to watch the entire video.
Improve Webpage Load Times
If your pages load slowly, readers probably won't wait. To improve load times:
- Use the right hosting provider.
- Optimize your images so they load efficiently.
- Reduce website redirects.
- Cache your pages so the server needs fewer resources to load each page.
Make the Content More Readable
Readability makes it easier for visitors to absorb and digest the content on your site. You can make your content more readable by:
- Making your point quickly: Avoid unnecessary words and make every sentence count.
- Using simple language: Keep your content at around a sixth- to eighth-grade reading level. You can measure that with tools like Microsoft Word or Hemingway.
- Avoiding large blocks of text: I try to keep paragraphs to four lines or less and break up text with headings, bullets, charts, or graphics.
Making the content helpful and interesting is also important. You want readers to trust you, so also consider incorporating expert opinions and authoritative sources.
Optimize Your Content for All Devices
Many people view the web on mobile devices. Content can look very different when viewed on a phone or tablet than when viewed on the web. Be sure your content is optimized for all these devices by using responsive web design, optimizing images, and choosing mobile-friendly fonts.
How to Determine Average Time on Page in Google Analytics
Google Analytics reported average time on page under Universal Analytics (UA), but UA has been replaced by Google Analytics 4 (GA4), which does not calculate this metric.
Under UA, time on page was measured from when a person landed on a page to when they navigated to the next. This created a problem when the page was the last one in the session, because there was no next page. UA couldn't measure the time someone spent on the last page of their visit.
This wasn't a very accurate way to measure time on page, and it's been replaced in GA4 by engagement time, which measures the total time a user spends interacting with each of your pages, including their exit pages.
To find engagement time for individual pages in GA4:
- Click on Reports in the navigation bar on the left side of your screen.
- Choose the Lifecycle option from the main menu.
- Select Engagement from the submenu.
- Select Pages And Screens, which will show you the average engagement time on each individual page.
You can sort this view based on the average engagement time from lowest to highest, so you can see the pages that perform the best, and the pages that perform the worst. This report will help you to identify which individual pages people are spending a lower average time on. These pages may need the most improvement to increase the total duration of time spent on your site.
Similar Metrics to Consider
While average time on page helps you determine how interesting and helpful your content is, it's just one of many page metrics that you may want to look into — and that may be guiding Google and other search engines in assessing the value of your content.
Here are a few other metrics you can track to see how engaged site visitors are — and what specific content may need improvement.
Scroll Depth
Like average time on page, scroll depth is a measure of how engaged visitors are with your content and how deeply they dive into it. But instead of telling you how long visitors spend on a page, scroll depth tells you how much of the page they consume.
Scroll depth refers to how much of the page people scroll to see. It can be measured vertically or horizontally, although site owners tend to focus on vertical scrolls. It's sometimes expressed as a percentage, so you might find out that site visitors are scrolling through 20% or 50% of a page. It can also be measured in pixels, in which case you might see that visitors have consumed 2,000 pixels of a 5,000 pixel page.
The further down your page people scroll, the better off you are. You'll have more chances to interact and convert them into customers, and search engines will get the signal that readers find your page helpful.
Bounce Rate
Bounce rate also helps you to determine whether visitors find your content worthwhile.
Bounce rate measures how many people land on your site and then leave immediately without engaging with the page they landed on or any other pages on your site. Under GA4, a visitor is considered to have bounced from, or left from, a page if any of the following are true:
- They were on the page for fewer than 10 seconds.
- They didn't trigger a conversion event.
- They didn't move on to a second page or screen view.
Someone clicking onto your page and then hitting the back button or closing their browser window after just a few seconds is said to have bounced.
This metric measures the number of single page sessions on your site, and a lower bounce rate is better than a high bounce rate, as you don't want people clicking to your site and leaving immediately.
Exit Rate
Exit rate refers to the rate at which people leave your site from a specific page, regardless of whether they first landed on it or not. It measures how often a particular page on your site is the last one in a visitor's session.
If someone visits your home page, navigates to page A, and then navigates to page B before leaving, this is referred to as a session. If this was the only session on your site, your home page and Page A would both have a 0% exit rate because no one left while viewing them, while page B would have a 100% exit rate.
Everyone eventually exits a website, so an exit rate of 0% isn't going to happen. Still, in general, the higher your exit rate for each individual page, the likelier it is that that page isn't meeting the needs of your website visitors and should be optimized.
Final Thoughts
Keeping site visitors on your pages for longer is an important goal. The more time people spend reading your web pages and the longer the total session duration, the greater your opportunity is to make an impression and convert them to customers.
By focusing on creating quality content that convinces people to keep reading, you'll both improve your search engine rankings and build relationships with your business. It's well worth the effort.